International Business Communication Standards (IBCS) Make Business Reports Clear and Readable
Source: Äri-IT Spring 2025
Author: Mihkel Nugis, BCS Itera BI Consultant Developer
From Challenge to Opportunity: How to Make Complex Data Visually Clear and Easily Understandable
Financial reports are a daily part of the work for accountants, analysts, and financial and corporate managers. Presenting data effectively and clearly is often a challenge, as complex tables and diagrams can quickly become confusing. This is where the international reporting presentation standard, IBCS (International Business Communication Standards), comes in.
What is IBCS?
IBCS is a set of rules and recommendations designed to standardize business reports and data visualizations. Its goal is to make reports:
- Clear: Avoid excessive information and provide easy-to-understand visualizations.
- Uniform: Use consistent symbols, colors, and formats so reports are easily readable and comparable.
- Efficient: Present data in a way that allows readers to make quicker decisions and identify important trends.
A report meets IBCS requirements if it follows seven rules, forming the SUCCESS acronym (the so-called SUCCESS formula):
- SAY (Convey the message): Every report must have a message; otherwise, it’s just a collection of data. Conveying the message requires introducing the topic and presenting reliable data that supports the message.
- UNIFY (Apply semantic notation): Things that represent the same concept should look the same. This principle applies to all report content, meaning terminology, metrics, highlights, etc., should be consistent.
- CONDENSE (Increase information density): All essential information should fit on one page. This requires efficient and thoughtful use of space, along with small but easily recognizable elements.
- CHECK (Ensure visual integrity): Information must be presented in the most truthful and understandable way, avoiding false scales, manipulated images, and misleading visuals.
- EXPRESS (Choose appropriate visualization): The selected objects (e.g., charts, tables, images) should convey the message along with the underlying facts as intuitively as possible.
- SIMPLIFY (Avoid excessive complexity): All overly complex, redundant, distracting, or purely decorative elements should be removed.
- STRUCTURE (Organize content): The content should have a logical structure, and its elements must be consistent and complete, without overlaps.
Why IBCS?
Decision-making in finance is often time-critical. Clear and standardized reporting helps save time and avoid misunderstandings. IBCS offers the following benefits:
- Time Savings: Uniformly formatted reports reduce the need for guidance and explanations.
- Improved Understanding: Comparing sales rates, profit margins, or costs across different periods or companies becomes easier.
- Professional Image: Consistent and cohesive report design enhances the company’s reputation.
- Fewer Errors: Standardized design reduces the risk of human error.

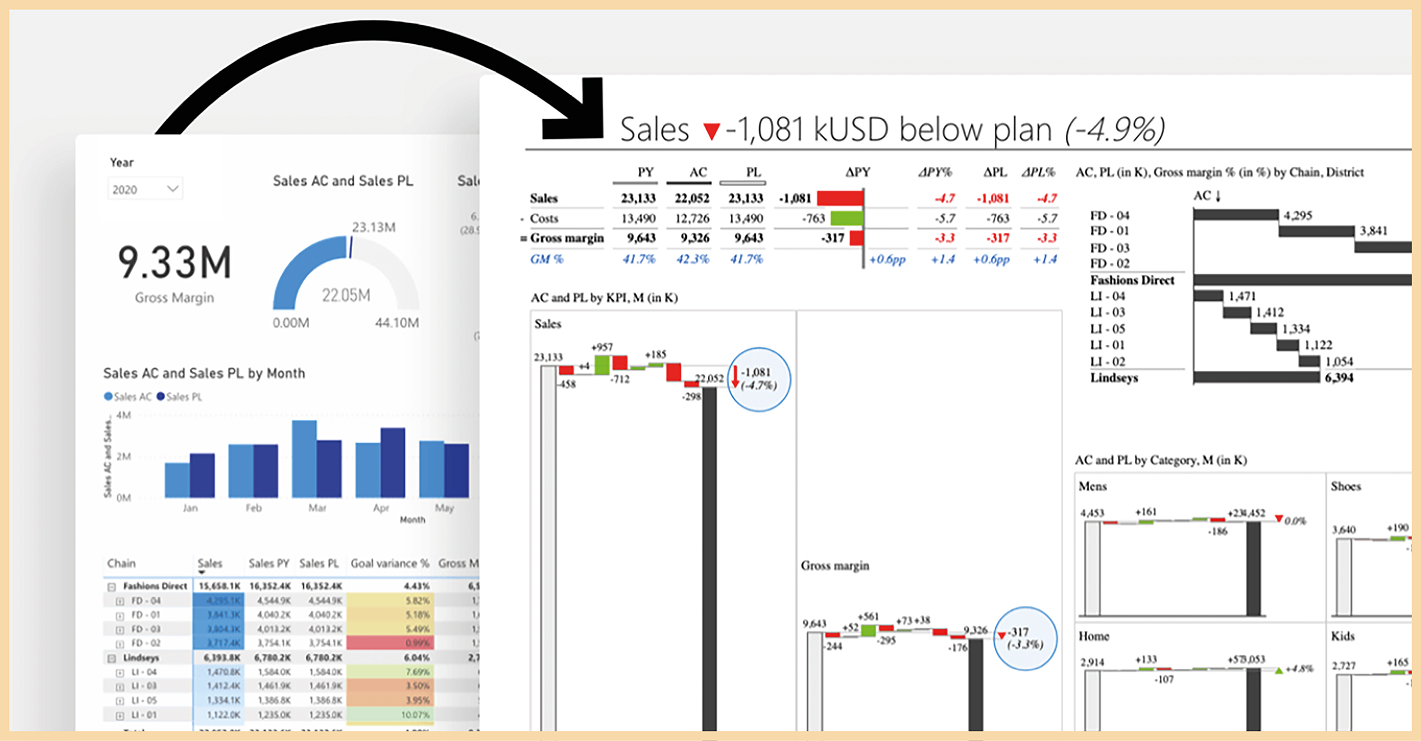
Figure 1. The report on the right aligns with the IBCS standard: neutral tones with red and green highlighting negative and positive changes (Source: https://zebrabi.com/ibcs/).
How Does IBCS Work in Practice?
IBCS recommends specific visualization methods and design principles to make reports clear and readable. Here are a few examples:
- Colors and Patterns:
- Use strong colors only for important points.
- Positive indicators can be displayed in green, negative in red, but other elements should remain neutral.
- Charts:
- Bar charts are used for comparing volumes and sizes.
- Line charts are suitable for showing trends and data that changes over time.
- To avoid confusion, use only one chart type when comparing a single data set.
- Symbols and Icons:
- Standardized symbols and icons help prevent ambiguity.
- Arrows: an upward arrow indicates growth, a downward arrow indicates decline.
- Uniform and Consistent Design:
- Always use the same typography and chart type for the same kind of data.
- The same color code should apply throughout the reporting period.

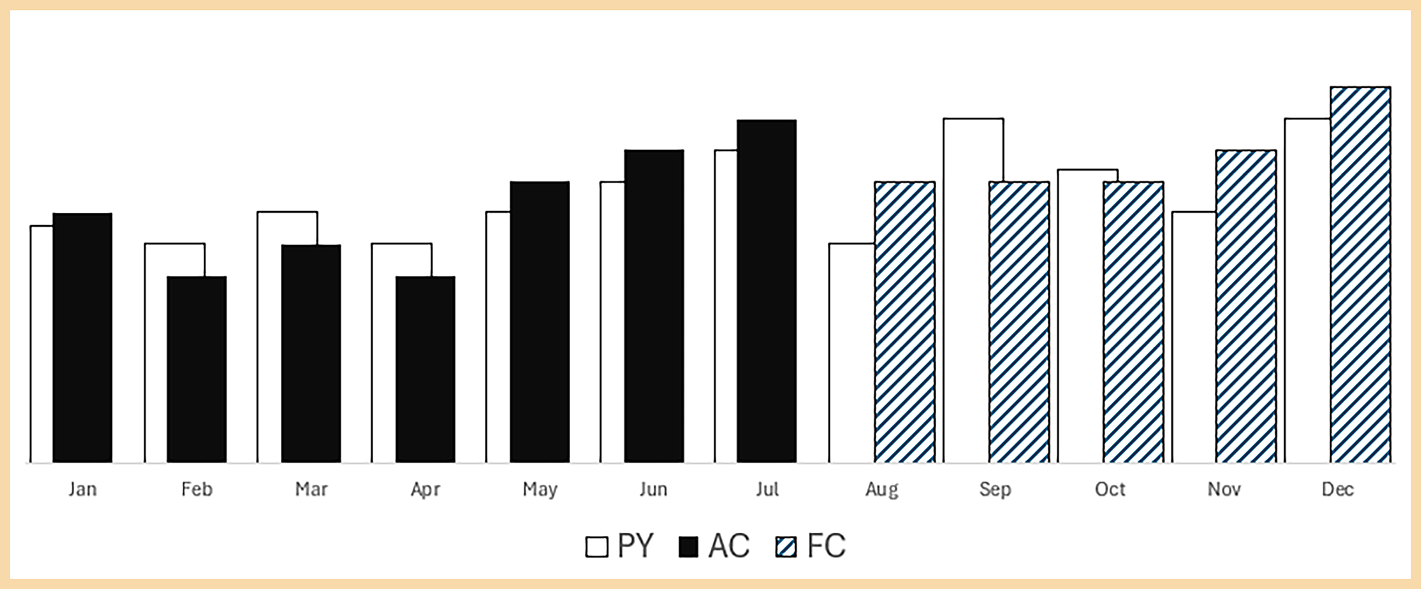
Figure 2. Bar chart depicting metric values by month (Actual value ’AC’, Previous Year ’PY’, Forecast value ’FC’).
Figure 2 illustrates a typical example of IBCS standard application, where the actual value is depicted with a dark background, previous period values with a white background and black outline, and future expected values as hatched bars. If the comparison were against a budget, IBCS recommends using a gray shade for the bars.
There are many report creation applications available. Some are well-suited for meeting IBCS requirements, while others may not offer all the necessary features. Excel, familiar to most report creators, provides great design freedom, making it relatively easy to create an IBCS-compliant report. The popular Power BI application also offers a wide range of design options, though it cannot, for example, use hatched backgrounds for bars, which is an IBCS recommendation for visualizing future values.
The market offers many report application developers whose products are IBCS-certified. If you want to save time when creating reports, such specialized applications can be very helpful.
Conclusion
IBCS is not merely a collection of design rules; it’s a strategic approach that makes reports clearer and more impactful. Adopting this standard can significantly improve financial communication, help reduce interpretation errors, and accelerate decision-making processes. If you want to take your financial reports to the next level, IBCS is an excellent choice.
You can find a comprehensive and detailed document on the IBCS website (https://www.ibcs.com/ibcs-standards-1-2/), where the seven categories of the SUCCESS formula discussed in this article are explained in more detail with examples.
If you find yourself struggling with IBCS implementation, BCS Itera’s experienced business intelligence team is ready to assist you.

